More than 2 years into the COVID-19 pandemic, telehealth has established a prominent and lasting role in healthcare delivery across various geographies, patient demographics, and clinical service areas.
This tool uses several million claims records from January 1, 2020, through June 13, 2022, to track telehealth adoption trends since the beginning of the pandemic to identify where we see the greatest impact—and infer where it is likely to remain in the future. Also see our latest report for additional trends and takeaways for healthcare organizations.
© 2022 The Chartis Group, LLC. All rights reserved. This content draws on the research and experience of Chartis consultants and other sources. It is for general information purposes only and should not be used as a substitute for consultation with professional advisors.
Analytics Methodology
Underlying data provided by Kythera Labs are sourced from clearinghouse claims vendors which comprise a national representation of submitted professional medical claims. These claims include self-insured and fully insured health plans across most major commercial payors and Medicare Advantage. The level of claims coverage varies by geography. Geographic and specialty utilization patterns may change over time based upon timing and mix of claims reporting by clearinghouse. Data is refreshed on a weekly basis, which includes data for the subsequent week, in addition to newly submitted claims from prior weeks.
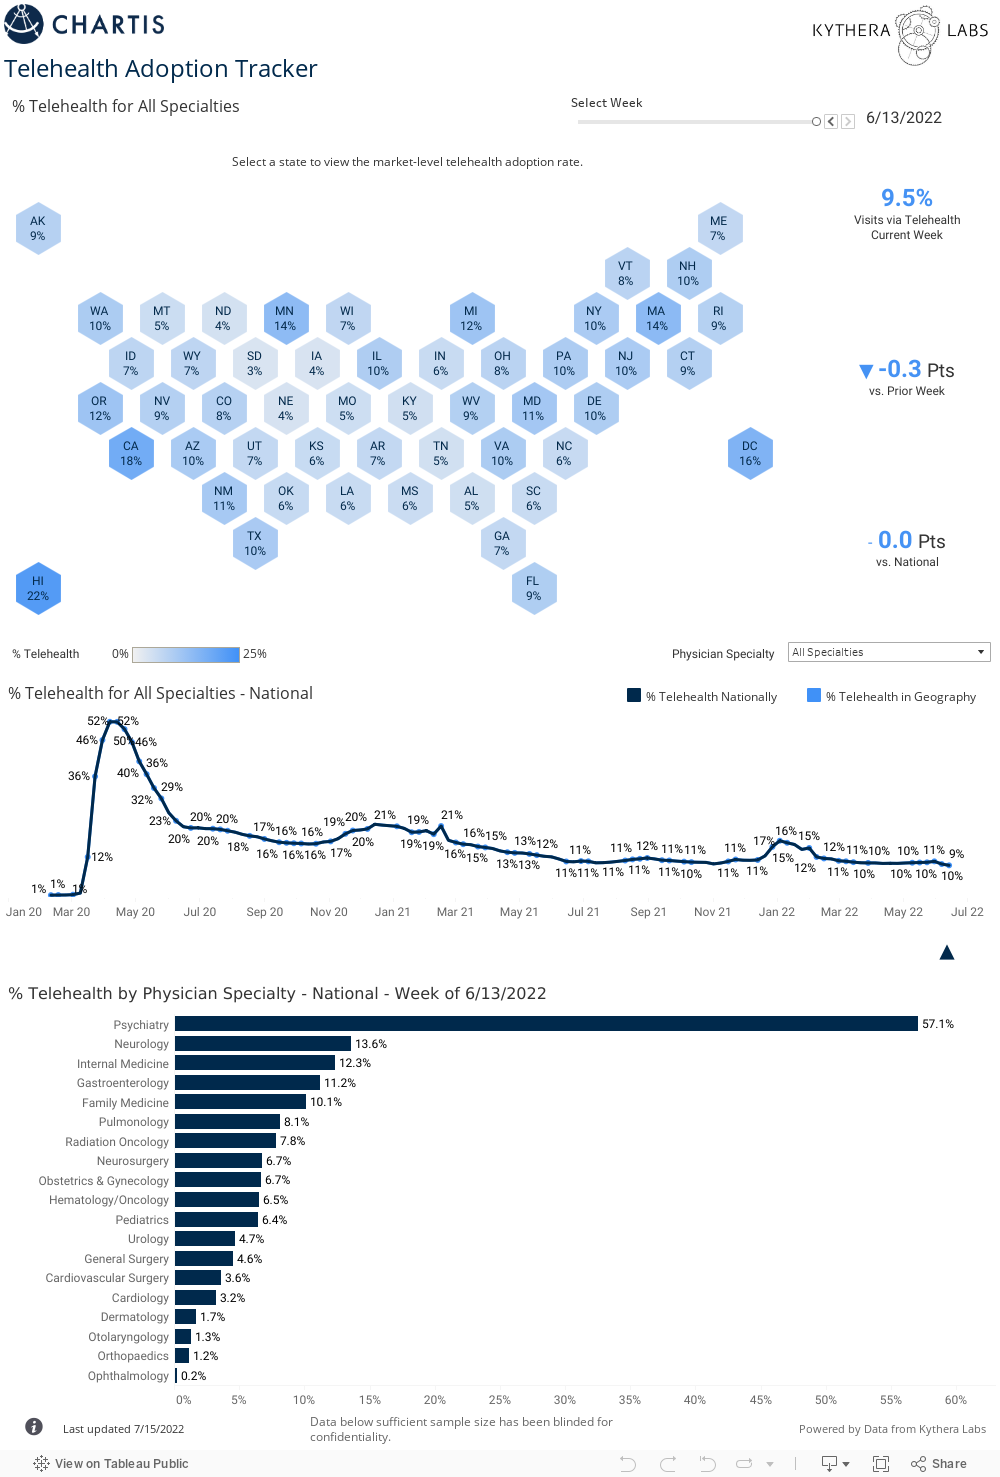
Effective July 2020: Modified methodology has been implemented for geographic analysis, now defined based upon patient location.
Data excludes providers billing from US territories: Puerto Rico, Guam and the Virgin Islands. Telehealth adoption rates for multi-state CBSAs will aggregate into the respective telehealth adoption rate calculation, identified and assigned by the respective provider state. Physician specialties are determined based upon the specialty assigned to the rendering provider NPI. Certain physician specialties are combined or excluded to form the 20 specialties reported in the analysis. APP-defined practitioners have been excluded from this analysis. Percentage telehealth rate is calculated as the ratio of unique telehealth visits as a proportion of total physician visits.